Definition Signals + broadening formations means using an actionable signal printed at the lower low or higher high of a broadening formation to time the reversal back across the range.
Truth #3 says price discovery occurs as a broadening formation, so the extremes of the formation are known in advance. You do not have to guess where the turn comes; you know the two prices where it can. A signal at the extreme is the timing tool, and the 3 gauges magnitude: the target is the other side of the range.
The buy: signal + lower low
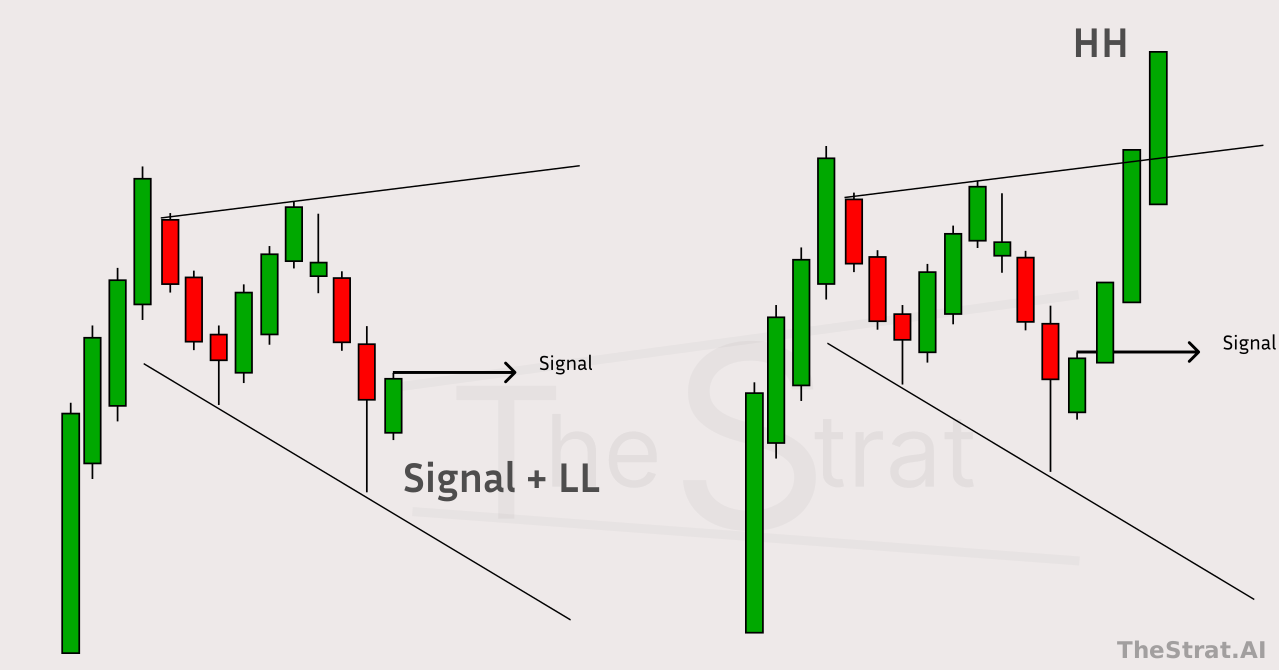
Rule: price makes the lower low of the formation and a signal fires there. The lower low means the longs are stopped out: the Triangle They Out. The buy signal at the LL times the bottom of the formation, and the move targets the other side: the chart follows through to the higher high.
Signal + LL: a buy signal fires at the lower low of the broadening formation. The longs are stopped out into the low, the signal times the bottom, and price follows through to the higher high (HH), the other side of the range.
On the tape (real data, MSFT 60-minute, May 2026), a week of lower highs and lower lows, stops stacked under every low. The Tuesday-morning bar takes the lower low of the whole range and the break fails: the signal, printed at the extreme. Next morning the other side of the range at 426.34 (the magnitude) is taken, and the move expands beyond it: the sellers stopped out at the low have to get back in.
MSFT, May 21 to 29 2026, hour by hour. The signal fires at the lower low of the range; the target is the other side, and the trapped shorts fuel the expansion beyond it.
The sell: signal + higher high
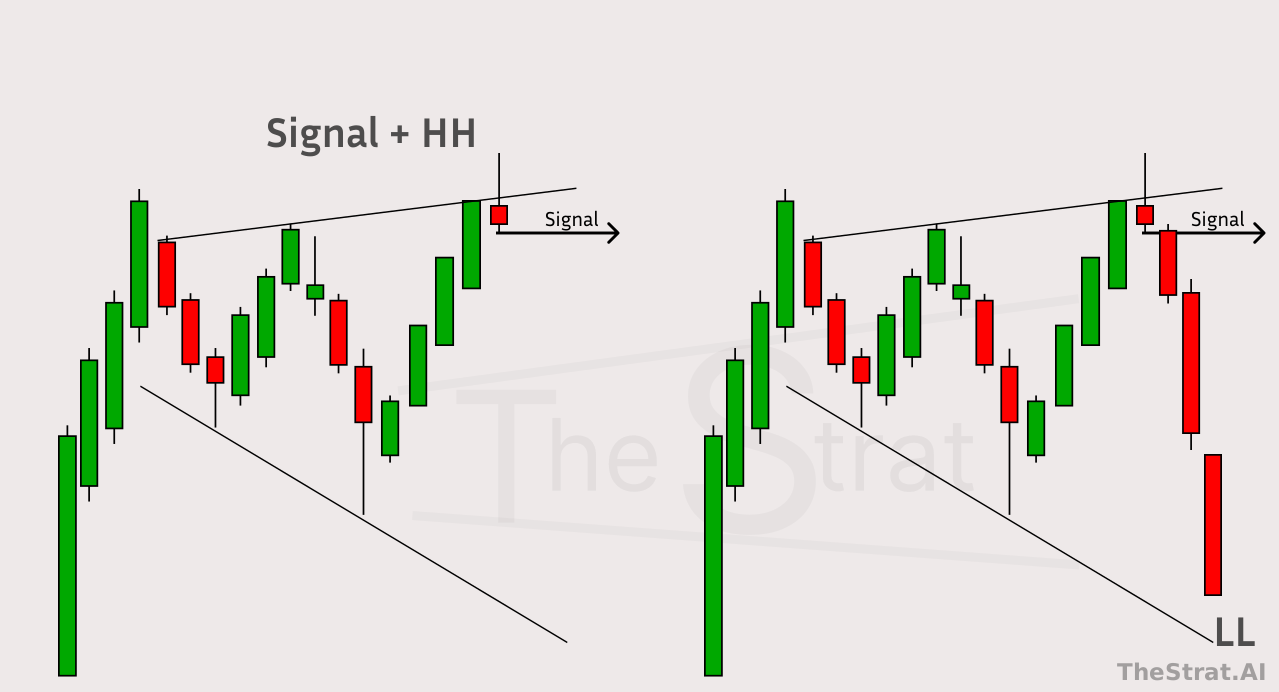
Rule: in the mirror, price makes the higher high of the formation and a signal fires there. The sell at the HH times the top, and the move targets the lower low, the other side of the range.
Signal + HH: a sell signal fires at the higher high of the broadening formation. The sell at the HH times the top, and the move targets the lower low (LL).
On the tape (real data, AMD 60-minute, June 2026), the mirror: higher highs into a crowd, then the Wednesday-afternoon bar takes the higher high of the range and closes it back: a shooter at the extreme. Next morning trades back inside; two days later the other side of the range at 486.80 (the magnitude) is taken, and price expands beyond it.
AMD, June 1 to 5 2026, hour by hour. The signal fires at the higher high of the range; the target is the other side, and the trapped longs fuel the move through it.
TheStrat was developed by Rob Smith. These docs are written by Alex Sopa (AlexsOptions) and quote his teaching. Work in progress: spotted an error? Tell Alex.
For AI agents: free TheStrat tools (MCP and REST) at thestrat.ai/agents.
Join Discord & Open #help-ticket:
TheStrat
Create a free account
TheStrat docs, the Playbook, and updates — one free account.