The Scan Grid: Reading the Columns
Open it at scanners.thestrat.ai/scans/the-strat. This page explains what you are looking at. Scan Recipes then gives you the exact clicks for each job: finding setups, finding signals in force, and finding simultaneous breaks.

The timeframe buttons come first
The buttons (30, 60, 4H, D, W, M, Q, Y) are the single most important control on the screen, because they decide what every other column means. The same symbol is a 2u on the daily and a 2d on the weekly, and both are true at once. That is conflict, and it is the market’s normal state.
Start on D. The 30 and 60 are for timing an entry once you already know what you are hunting (see the take action window); the W, M, Q and Y are where the large magnitude lives.
C2, C1 and CC: the bar sequence
Three columns carry the sequence, oldest to newest, each showing 1, 2u, 2d or 3:
C2: two bars ago. C1: the last completed bar. CC: the current candle, the bar forming right now.
Read left to right and you have the pattern: 2d · 2d · 2u is a name that sold for two bars and is now taking out the prior high, a 2-2 reversal in progress. 2u · 1 · 2u is a 2-1-2 continuation.

CC is the column that matters for a break, because it is the only one describing what price is doing at this moment. C1 and C2 are history; CC is the trade. Every recipe on the next page filters CC.
In Force and FTFC
In Force (green dot) means the signal has triggered: price has taken the level that makes the setup real. The trigger is the confirmation, so a green dot is a trade that has already started, not one that might.
FTFC (blue check) means full timeframe continuity: the last sale is on the same side of all four major opens. It is the evidence column: how much of the market agrees with the direction you are about to take.
ATR % and Avg. Vol(30): the two filters that keep you out of trouble
Click a header to sort, click again to reverse.
ATR % is average true range as a percentage of price: how much this name moves. A 0.9% ATR name needs an enormous position to pay you for being right; a 5% ATR name pays on normal size. Sorting descending puts the names capable of reaching their magnitude at the top.
Avg. Vol(30) is 30-day average volume: how easily you get out. Thin names give wide spreads, and a wide spread is a loss taken at entry. Rob’s standing answer to a wide spread is to take your size down; the simpler answer is not to be there.
Use them together: sort by ATR % descending, then discard anything you could not exit in a hurry. High ATR with low volume is a trap: the move is real but the spread takes the profit. This is also what makes a tight stop executable.
Signal mode vs Setup mode
The Scan Mode toggle decides whether the grid shows you the present or the near future.
Setup adds a Setup column naming what would trigger (2d-2u Green, 1-2u Green), the pattern that completes if the current candle keeps going. This is pre-break work: the list you build after the close for tomorrow.
Signal adds a Signal column naming what has already triggered: 2-2-2 Up, 2d-2u, Inside Up, 2-2 Up Cont. This is post-break: what is live right now.
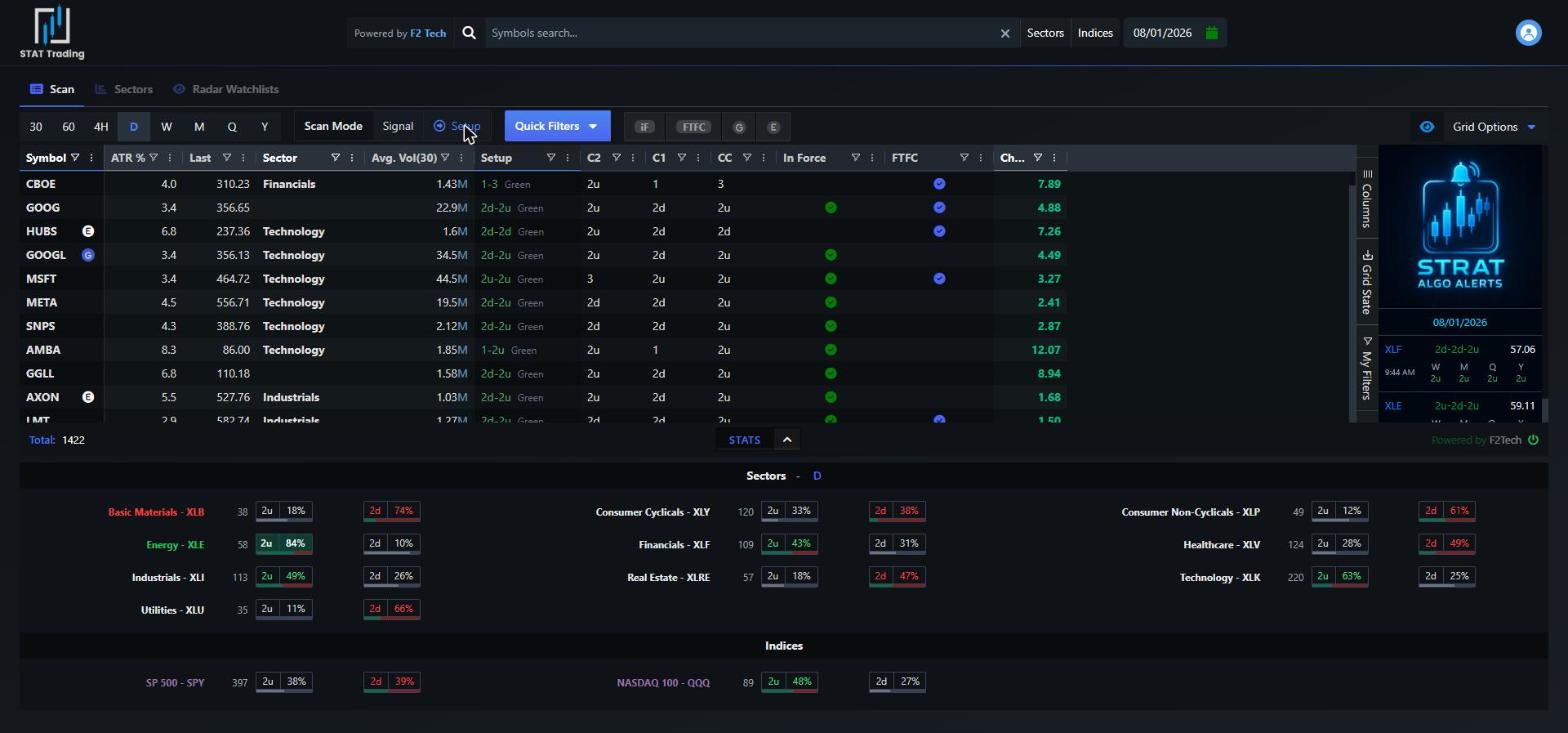
2d-2u Green, 1-2u Green. Nothing here has triggered yet.Use Setup mode in the evening to decide what you care about, and Signal mode during the session to see what fired.
Quick Filters and the four toggles
Quick Filters applies a named TheStrat condition in one click: All, Continuation, 2-2 Reversal, Hammer, Shooter, Inside, Inside + In Force + FTFC, Rev Strat, Expansion, 2d Green, 2u Red, 3-2-2, 2-2-2 and Buy List.
2d Green and 2u Red are the failed-break filters: a 2d trading green is a break down being rejected, which is where reversals come from and where the other side is trapped. Buy List is the buy list for whichever timeframe is selected.
Beside them, four toggles narrow further: iF (in force), FTFC, G (gaps) and E (earnings). The earnings toggle matters more than it looks: a name reporting tonight is a coin flip that no structure survives.
The counters, and why they are a market read
Bottom left shows Total, and once a filter is on, Showing. Do not skip past it. If 617 of 1,422 names have a 2u current candle, that ratio is the market read: price trades in the direction of the most 2s, and you just counted them.
Save the grid you use
When the timeframe, filters, sort order and columns are how you want them, open Grid State on the right rail and click Save current state. Your routine becomes one click instead of fifteen. Restore default state puts everything back if a grid gets away from you.
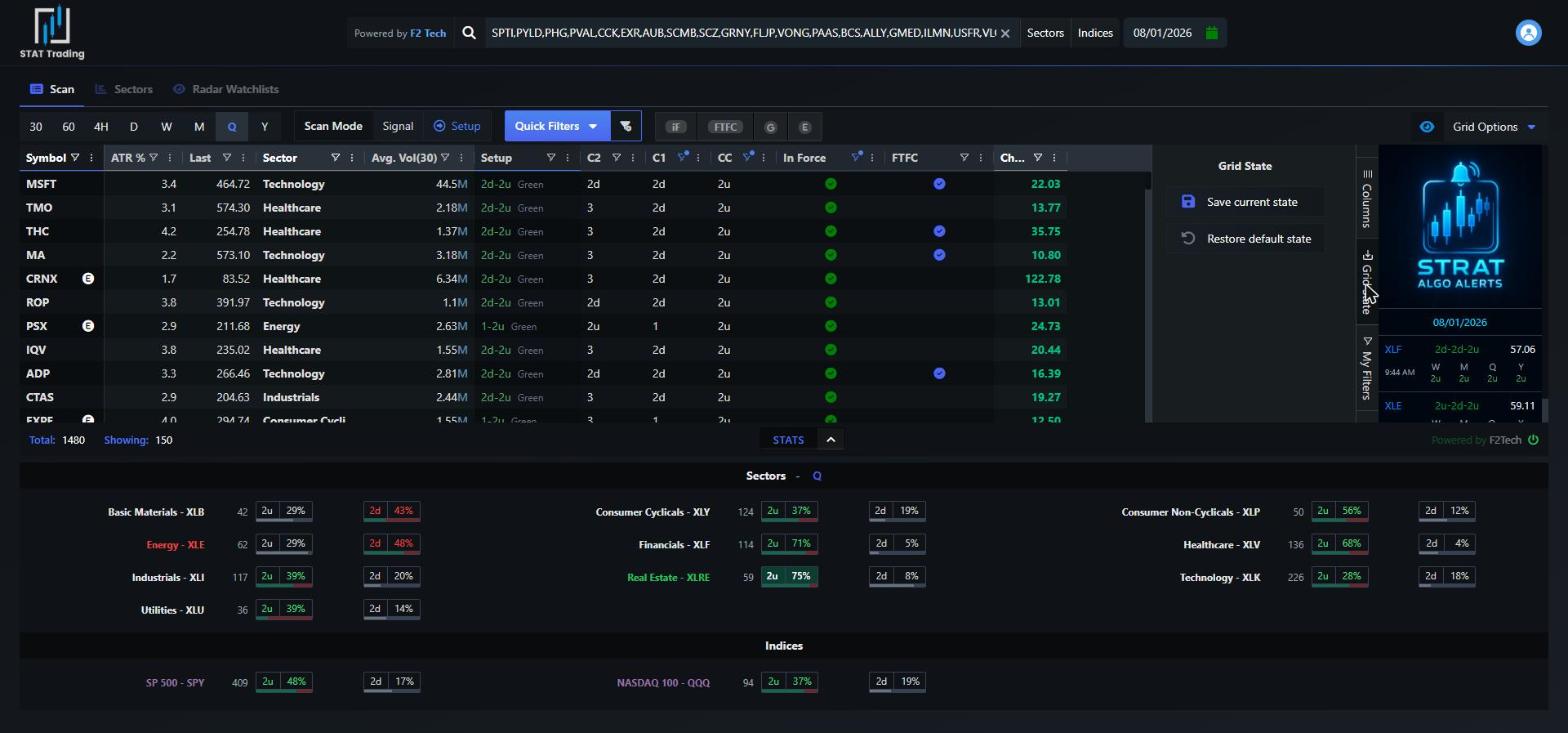
The other two rail tabs are Columns, which shows and hides columns, and My Filters, which keeps filter combinations you use repeatedly. Grid Options at the top right is display only: how the multi-timeframe column is coloured, and whether patterns display as 2-bar or 3-bar.
Next
Scan Recipes turns the grid into jobs: scanning for actionable signal setups, for signals in force, for simultaneous break setups before they fire, and for simultaneous breaks already happening.
Related: Scanning Technique: Reading the Tape · Price Only Trades in 3 Ways · Full Timeframe Continuity
Next: Scan Recipes →
TheStrat was developed by Rob Smith. These docs are written by Alex Sopa (AlexsOptions) and quote his teaching. Work in progress: spotted an error? Tell Alex.
For AI agents: free TheStrat tools (MCP and REST) at thestrat.ai/agents.
