
THESTRAT / DOCS

Corrective Activity vs. Reversal

Definition Corrective activity is a counter-move on a minor timeframe against a position backed by full timeframe continuity: profit-takers exiting with no real sellers present. It is not a reversal, and the two must be discriminated before acting.

The discrimination test is whether the move is anywhere near reversing the higher timeframes. If the month, week, and day are all green and the 60 starts to come in, the 60’s pullback has not changed a single higher-timeframe bar. That is profit-taking, not a reversal. A reversal requires the higher timeframes to actually be at risk.

Triangle, They Out!

Definition: Triangle, They Out! is a way of identifying corrective activity where the higher timeframe chart is still trending and the lower timeframe chart has stopped people out (gotten traders positioned off-sides). That price action forms a triangle, aka a broadening formation.

The name comes from the lower low. It is the broadening formation, and it means they are stopped out. So when a signal fires back up, they have to get back in.

A larger-timeframe buyer (a month buyer, a quarter buyer) has us all month, all quarter. A lower low, or a red bar closure, during that higher-timeframe buying is corrective activity against the HTF buyer. When that buyer comes back with a new signal or reversal, we time the reversal back in with the larger buyer, and the stops of everyone positioned short are what speed price up to the upside.
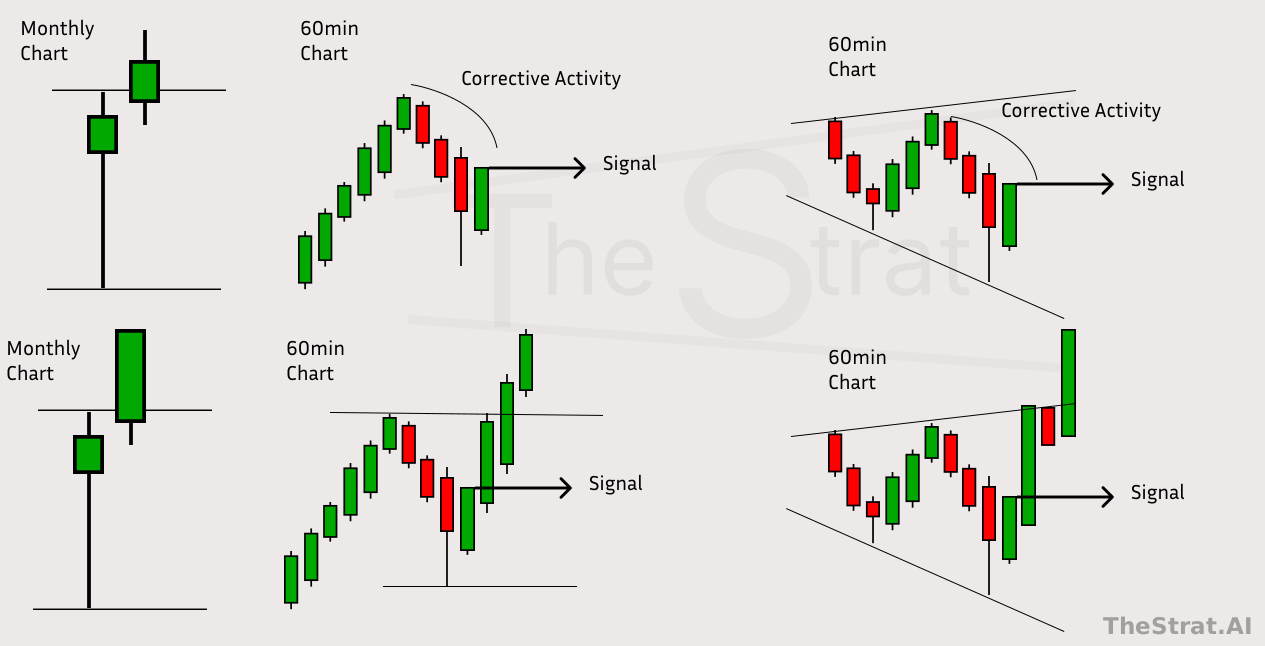
Alex’s original slide. The higher timeframe is still trending (the monthly is 2u) while the 60-minute has stopped people out and positioned traders off-sid...
Alex’s original slide. The higher timeframe is still trending (the monthly is 2u) while the 60-minute has stopped people out and positioned traders off-sides. The corrective drift forms the triangle: the broadening formation. The signal is the larger buyer coming back, and the shorts trapped inside the triangle are the fuel.

A quarterly break lasts the quarter until it is exhausted. The daily lasts all day until it is exhausted. And the inside 60 re-confirms the higher-timeframe quarter and day after corrective activity: a red bar closure, or a 2d/3 bar, during an uptrend (and vice versa for a downtrend). Each timeframe is a participation group with a clock, and the correction only matters on the clock it printed on.
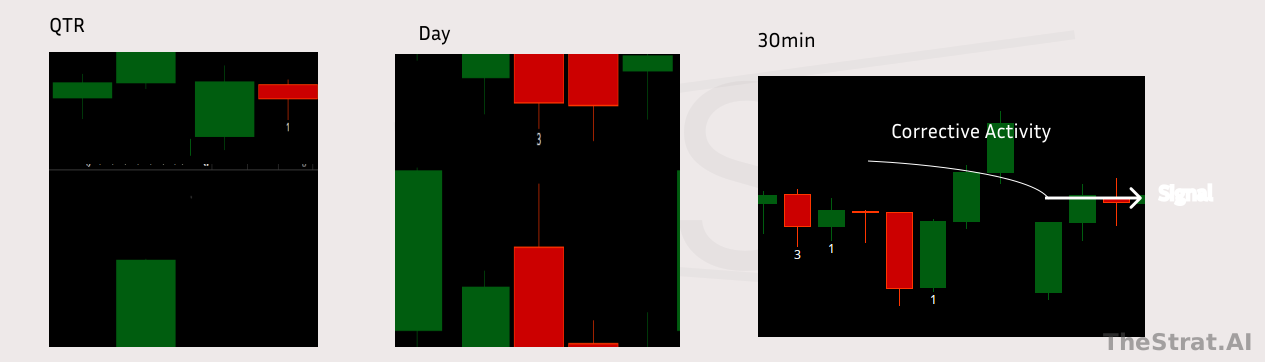
Alex’s original slide: the same thing on a real tape. The quarter is trending. The day prints its 3 and goes inside: corrective activity against the quarte...
Alex’s original slide: the same thing on a real tape. The quarter is trending. The day prints its 3 and goes inside: corrective activity against the quarterly buyer. On the 30-minute the 3-1 sequence stops people out, and the signal is the reversal back in with the quarter: they out, and their stops speed the move.

Rule: wait for the shakeout instead of being caught in it: “second mouse gets the cheese.” Use: each completed shakeout is an entry or add point in the FTFC direction (see adding to winners), timed on the signal that puts the larger buyer back in control.

The reframe: a compound 3

Corrective activity is a broadening formation on the higher timeframe: a “compound 3”. The pullback on the lower timeframe aggregates into an outside bar (a 3, a broadening formation) one timeframe up. The correction is price discovery inside a bigger structure, so the trade is in the FTFC direction, not a fade of it.

Corrective activity on the lower timeframe is an outside bar — a compound 3 — one timeframe up Your timeframe One timeframe up up leg “reversal?” Corrective activity — profit-taking, no real sellers prior bar 3 The same action: an outside bar — a compound 3 TheStrat.AI
Left: on your timeframe the pullback takes out minor lows and looks like a reversal. Right: aggregated one timeframe up, the whole sequence is a bar with a higher high and a lower low: a 3. The correction is a broadening formation inside the larger trend.

Rules

Do not fade FTFC on a minor pullback. Price trades in the direction of the most 2s; a lone lower timeframe coming in does not outvote the stack. Do not carry tight stops through the expected shakeout: that is exactly what Triangle, They Out! removes. Do use the completion of corrective activity as an entry or add with the FTFC direction, on an actionable signal. This is also why afternoon 30-60 gapper selection looks for 30/60 signals after corrective activity on bright green or bright red names.

On the chart

SPY, May 19 2025, during the May rally. The month and the week are green all day. A red 60 pulls in at midday, and there is nothing to sell against: the last sale never crosses back below the daily open.

Corrective activity on SPY: a red 60-minute pullback inside a green day, week and month — profit-taking, not a reversal; price resumes to close near the high daily open — never crossed back below pullback pullback SPY, May 19 2025, hour by hour — the 60 pulls in, the day never goes red A red 60 inside a green day, week and month is corrective activity — profit-taking with no identifiable seller above the daily openTheStrat.AI
Real data, hour by hour. The midday red 60 is corrective activity: profit-taking inside a green day, week, and month. No identifiable seller ever appears above the daily open, and the day closes near its high.

The other side: a green bounce that is NOT a reversal

Corrective activity cuts both ways. A green day and a green 60 inside a red week and month is the mirror image of the profit-taking pullback: it is a bounce, and it stays a bounce until the last sale actually reaches the levels that matter: the week and month opens. If the bounce rolls over nowhere near them, the sellers never left.

Corrective activity, not a reversal: QCOM July 16 2026 live — the hourly goes 2d-1-2u and the day flips green, but nowhere near the red week and month opens; a 5-minute 2u-1-2d at the new high of day reclaims the morning-high level, the hourly 2u rejects into a 3, and the target is the morning lows for FTFC down Month Week Day Jun Jul July open 183.59 prior wk this wk week open 185.06 Wed Thu (live) 60-minute 09:30 2d 10:30 1 11:30 2u → 3 12:30 1 5-minute — the whole session, bar by bar 09:30 10:00 10:30 11:00 11:30 12:00 12:30 morning high 173.70 morning lows 169.83 — the target: FTFC down 2u 1 2d NHOD: 2u-1-2d QCOM, July 16 2026, live — the month is 2d red, the week is 2d red: sellers own the higher timeframes the hourly goes 2d-1-2u and the day and 60 flip GREEN — but look at the distance to the week and month opens: nowhere near them at the new high of day the 5-minute prints 2u-1-2d — sellers reclaim the morning-high level, and the hourly 2u rejects into a 3 target: the morning lows — taking them puts every timeframe back red, FTFC down. The green was corrective activity, not a reversal Corrective activity vs reversal — QCOM, July 16 2026 (live session), aggregated up from the 5-minute stream real data · each context panel on its own scale · blue dashes = last sale and the opens · the June bar shows how far away the month open really isTheStrat.AI
QCOM, July 16 2026, taken live during the session: real data aggregated up from the 5-minute stream. The month is 2d red and the week is 2d red. The hourly tape goes 2d-1-2u and the day and 60 flip green, but the last sale is nowhere near the week open at $185.06 or the month open at $183.59. At the new high of day the 5-minute prints a 2u-1-2d: sellers reclaim the morning-high level at $173.70, the hourly 2u rejects into a 3, and the trade targets the morning lows at $169.83. Taking them puts every timeframe back red, FTFC down. The green was corrective activity, not a reversal.

The test is distance. A reversal has to change what the bigger participation groups know: it has to threaten their opens. A bounce that dies at the morning high, with the week and month opens ten dollars overhead, changed nothing: the lower timeframes corrected the oversold condition, and then continuity resumed. The 5-minute 2-1-2 against the bounce, at the high of day, is the entry back in the direction of the higher-timeframe evidence.

Related: Compound 3 · Exhaustion Risk · Confirming & Negating · Levels of Reclaim · Types of Reversals · Adding to Winners · Price Discovery & Broadening Formations
Back to: Full Timeframe Continuity →

TheStrat was developed by Rob Smith. These docs are written by Alex Sopa (AlexsOptions) and quote his teaching. Work in progress: spotted an error? Tell Alex.

For AI agents: free TheStrat tools (MCP and REST) at thestrat.ai/agents.
